Energy Consumption of Buildings: What It Is and How Much It Really Is
A building's energy consumption is all the energy it draws for heating, hot water, cooling, ventilation, lighting and plug loads — usually expressed in kilowatt-hours per square metre of floor area per year (kWh/m²·a). In most European buildings, space heating is by far the largest single item, followed by hot water and electricity for equipment.
Two numbers matter. Final energy is what arrives at your meter — gas, district heat, electricity — and it is what you pay for. Useful energy is what the building actually needs after boiler, heat-pump and distribution losses. Consumption is normally split into heating, domestic hot water, cooling, ventilation, lighting and appliances/process loads. Report it as kWh/m²·a so you can compare a small office with a large hotel; report the absolute kWh only for cost.
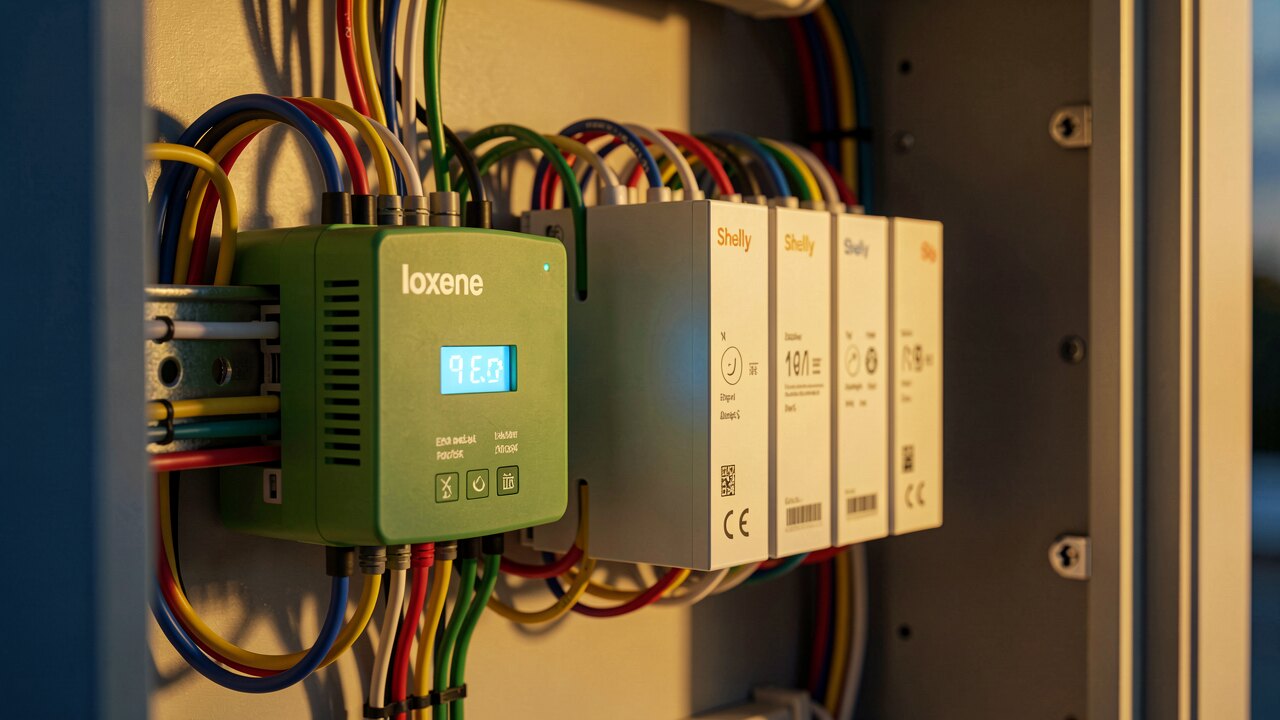
1) Collect 12 consecutive months of meter readings for every energy carrier (gas in m³ or kWh, electricity in kWh, district heat in kWh). 2) Convert everything to kWh and add it up. 3) Divide by the heated/conditioned floor area in m². 4) Weather-correct the heating share against a normal year using degree-days, otherwise a mild winter will flatter your result. Do this per meter, not per site — a single site meter hides which building or which system is the problem.
Residential and office buildings are heating-dominated: the envelope and the heating system decide the outcome. Hotels, hospitals and swimming pools are hot-water- and ventilation-heavy and run around the clock, so their electricity share is much higher. Data-heavy and refrigerated buildings are driven by cooling. Large venues behave differently again — for stadiums, consumption is concentrated in a few event days with floodlighting, catering and HVAC peaks, while baseload between events is comparatively small. Identify your dominant load before you spend money; a measure aimed at the wrong load will not pay back.

Annual meter readings tell you the total, not the cause. Interval data (15-minute or better) shows the nightly baseload, the start-up peaks, and the systems that never switch off. A common finding is a high overnight baseload — ventilation, pumps or lighting running when the building is empty. That is usually the cheapest saving available, because it needs a schedule change rather than capital expenditure. Sub-meters on the main circuits (heating, ventilation, kitchen, lighting, IT) turn a single number into an actionable breakdown.
In rough order of cost-effectiveness: correct control settings and time schedules (heating curve, setback, ventilation runtimes); hydraulic balancing and pump replacement; heat recovery on ventilation; LED lighting with presence and daylight control; insulation of pipes and the building envelope; then heat generation (heat pump, CHP) and on-site PV with storage. Controls and scheduling come first because they cost little and act on the load you already have — new plant sized for an unoptimised load is simply oversized plant.
For larger buildings the bill has two parts: energy (kWh) and demand or capacity charges based on the highest measured peak. A short peak — everything starting at once on a Monday morning — can raise costs for a whole billing period even if total consumption is unchanged. Staggered start-up, load shifting and battery storage (peak shaving) target that peak specifically. Track kWh and kW separately; they respond to different measures.