How to Display Your Solar Energy Generation
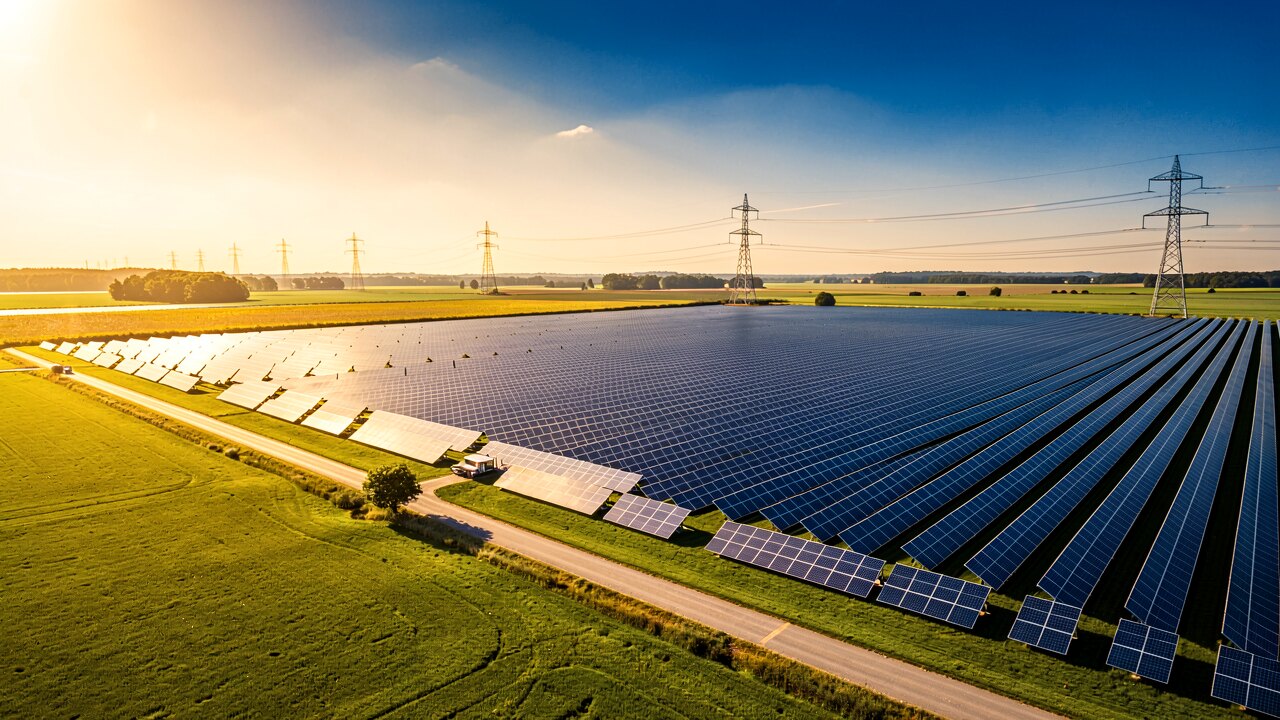
To display solar energy generation, read live data from your inverter (via its built-in portal, app or Modbus/SunSpec interface) and show it as instant kW output plus daily kWh totals on a screen or dashboard. Below are the fastest ways to get that display running, from a free inverter app to a full real-time energy dashboard.
Almost every modern string or hybrid inverter (SMA, Fronius, SolarEdge, Huawei, GoodWe and others) ships with a free monitoring portal and mobile app. Register the device serial number once, and it displays current PV power (kW), today's yield (kWh), and lifetime generation. This needs no extra hardware — the inverter pushes data over Wi-Fi or Ethernet to the manufacturer cloud.
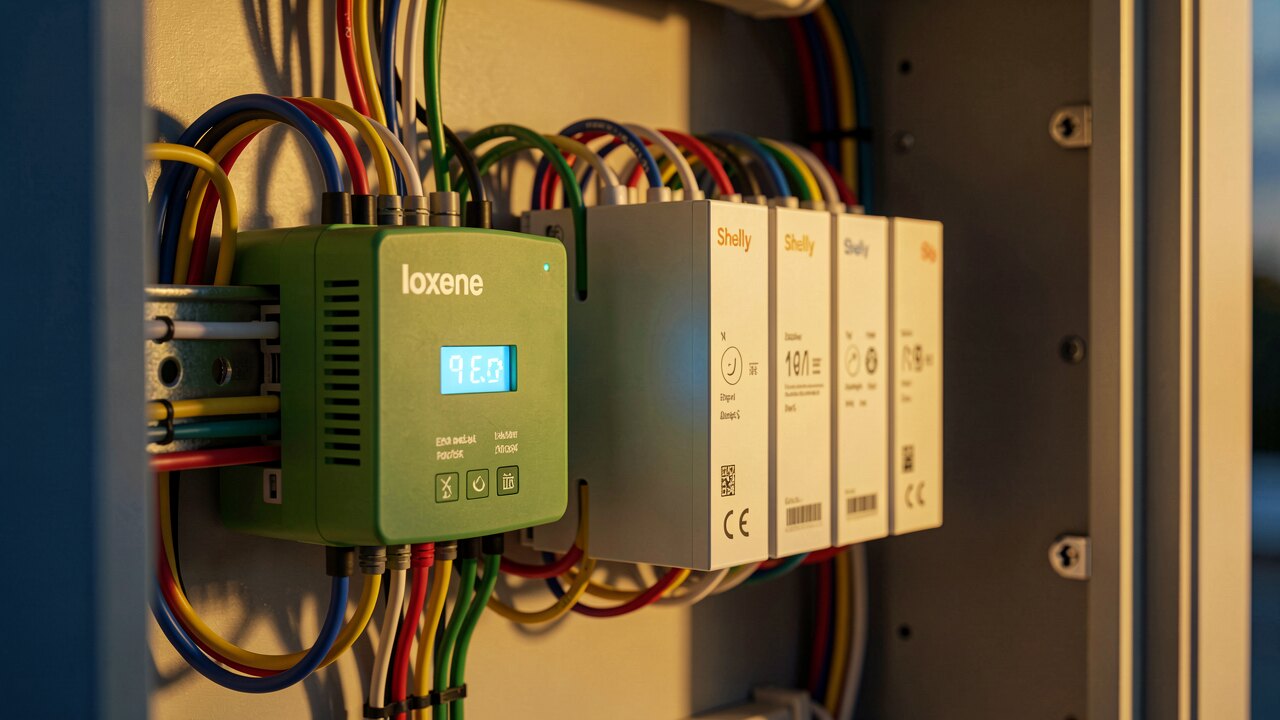
A useful generation display combines three views: instant power (e.g. 285 kW of a 400 kWp array), a 24-hour production curve, and cumulative energy for the day, month and year. Add self-consumption vs. grid export, and — if you have a battery — state of charge (SOC %). Together these turn raw numbers into a picture you can act on.
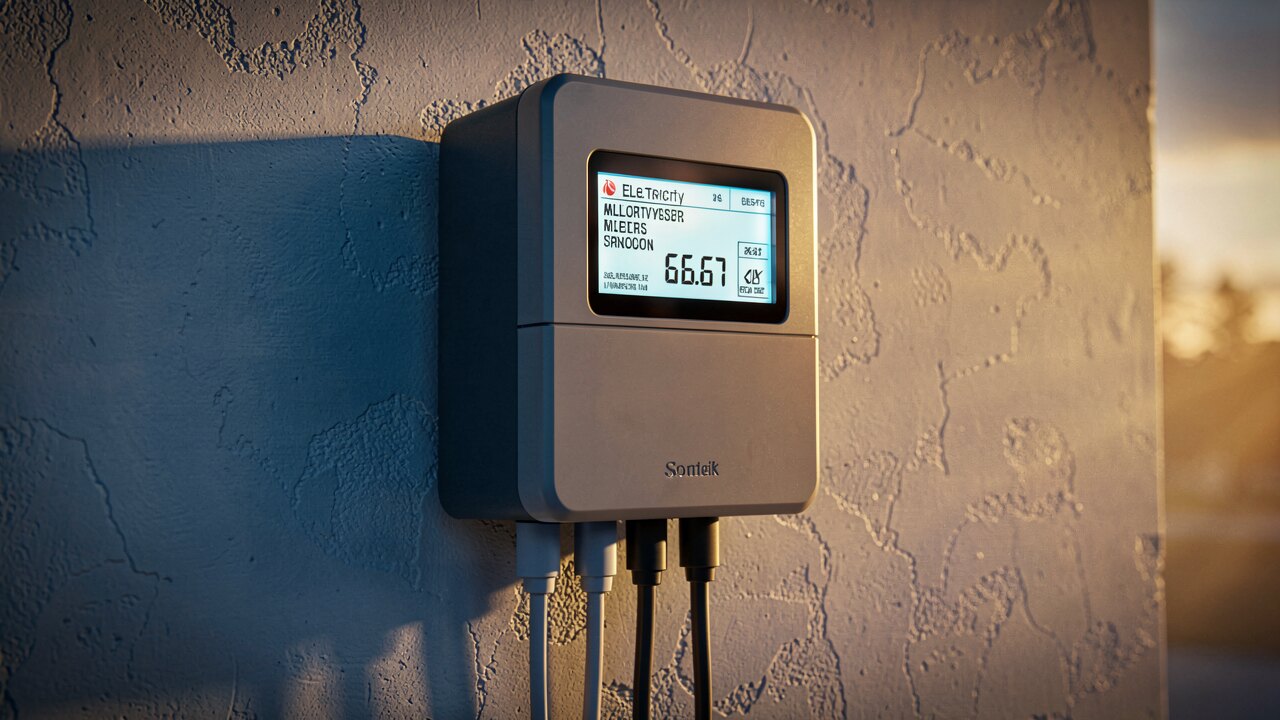
For a custom or wall-mounted display, use a data logger or gateway that reads the inverter via Modbus TCP/RTU or the SunSpec standard, then feeds a dashboard tool such as Grafana, Home Assistant or a vendor energy manager. This lets you show PV production, grid load and spot price side by side on one screen, refreshed every few seconds.
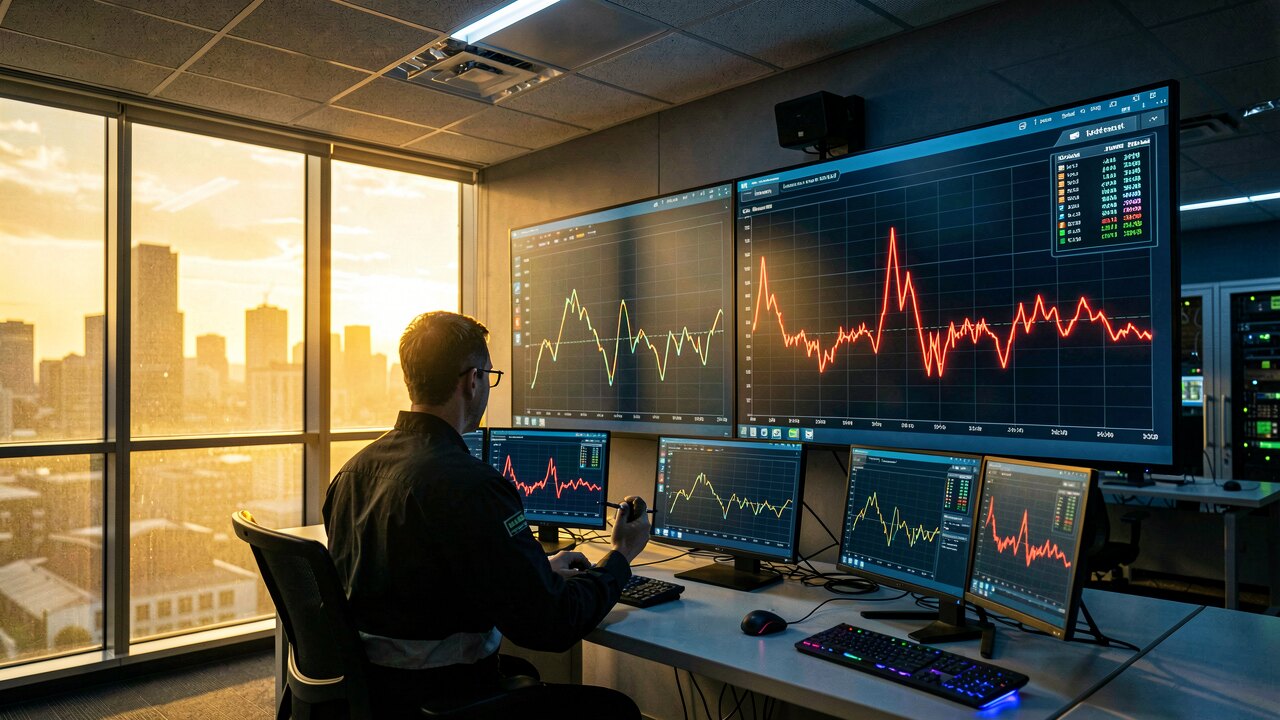
Generation alone is half the story. Overlaying the electricity spot price (e.g. €/MWh on the day-ahead market) shows when your midday solar is worth the least and when evening peaks make stored energy valuable. A display that pairs PV output with price and battery SOC helps you decide when to store excess and when to use or export it.
Once the data is flowing you can display it anywhere: the manufacturer app on a phone, a tablet by the front door, a TV running a browser dashboard, or a public web page. Choose a low-power always-on screen for a permanent 'energy hub', and keep the mobile app for quick checks and alerts (e.g. when production drops unexpectedly, which can signal a fault).