Photovoltaic Display: How to Read Your Solar Monitor
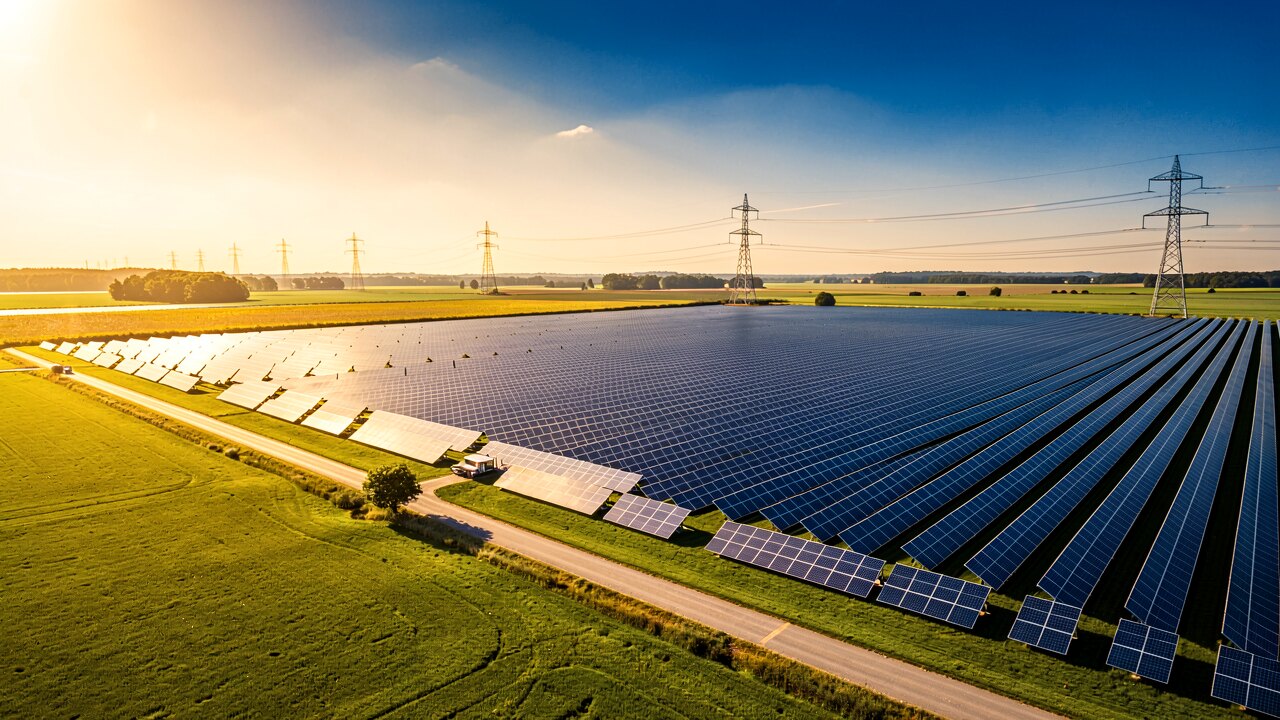
In German, "Anzeige Photovoltaik" means the display or readout of a solar system — the screen on your inverter, portal or app that shows what your panels are producing right now. This page explains what each value means and how to read it.
A photovoltaic display shows the live and cumulative data of your solar system. The core readings are: current PV output (in kW or W — how much your panels generate this second), today's yield (in kWh), total lifetime yield (in kWh or MWh), and often self-consumption vs. grid feed-in. If a battery is connected, you also see its state of charge (SOC in %). If a home-load meter is present, you see current consumption in kW.
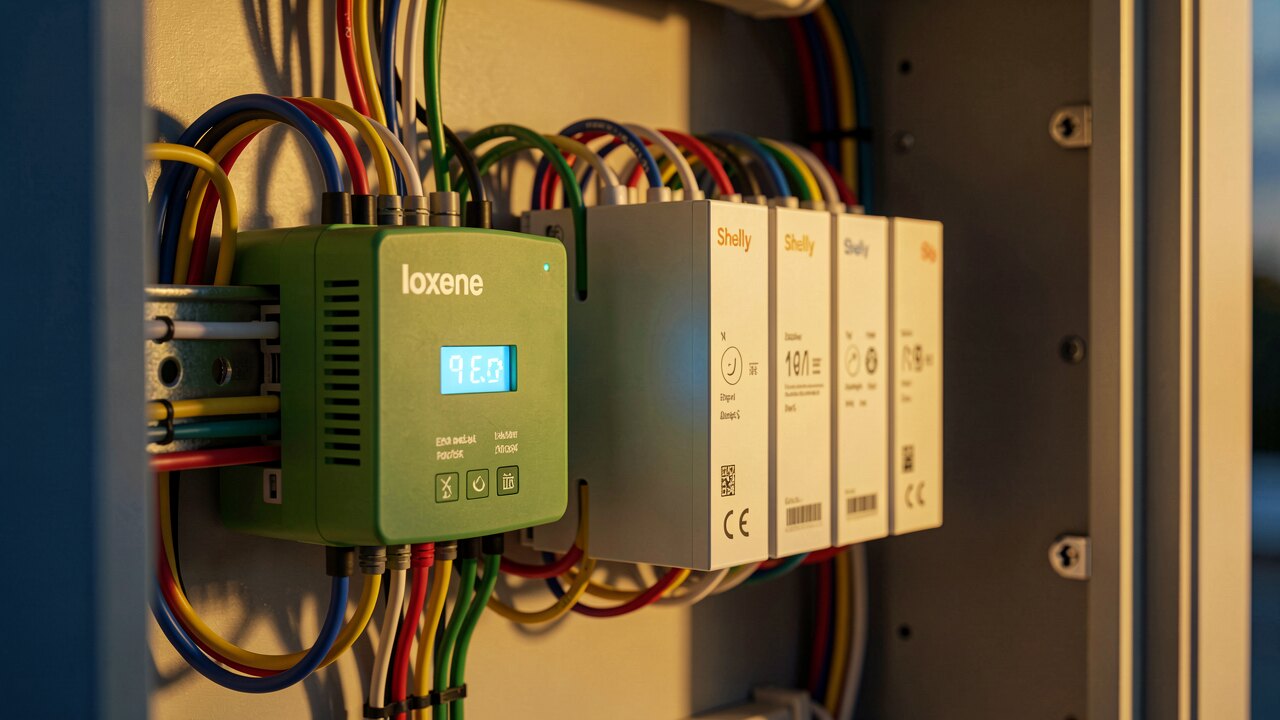
Start with two values. (1) Power now (kW): this rises and falls with sunlight — near zero at night, peaking around midday. A 10 kWp system might show ~8 kW on a clear noon. (2) Energy today (kWh): a running total that only grows through the day and resets at midnight. Power is a snapshot; energy is the sum. If "power now" is 0 during bright daylight, something is wrong (see below).
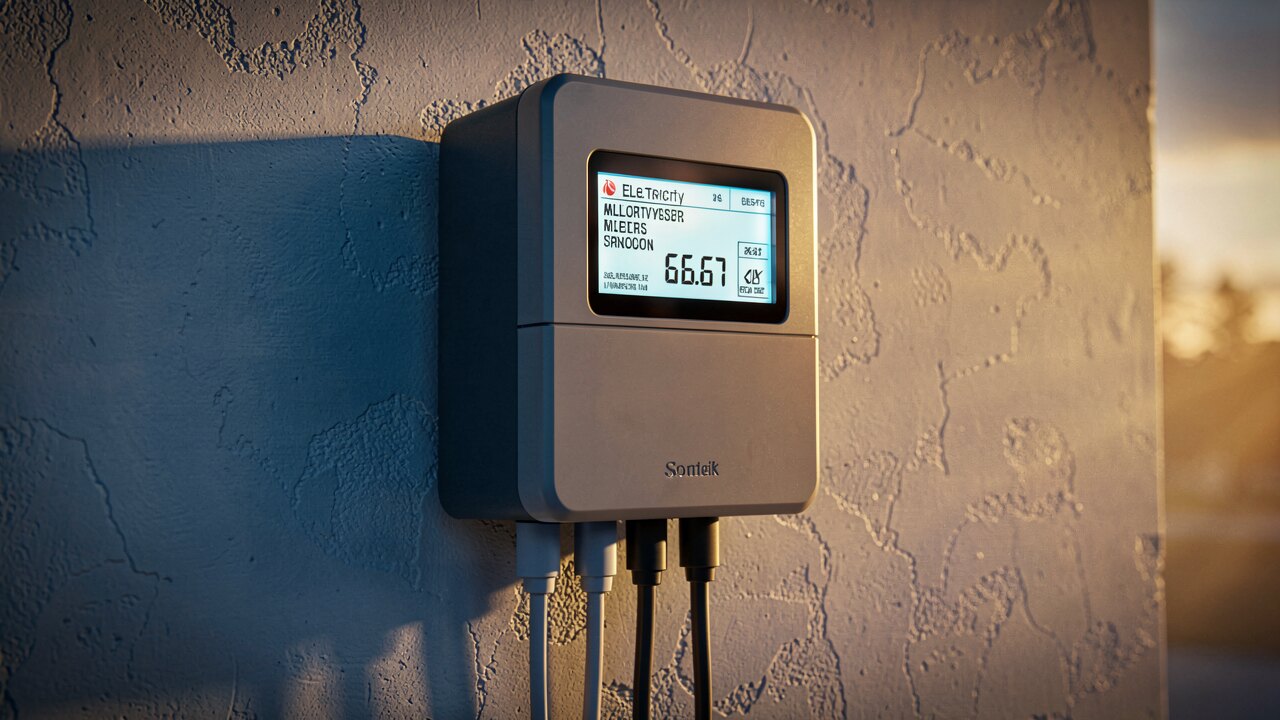
There are usually three places to see the same data. The inverter's built-in screen or LEDs (local, at the device); the manufacturer's web portal (e.g. via browser, historical charts); and a smartphone app (push alerts, remote view). Battery and energy-management systems add a live dashboard showing PV power, battery SOC, house load and — in trading setups — the current electricity price in €/MWh, all on one screen.
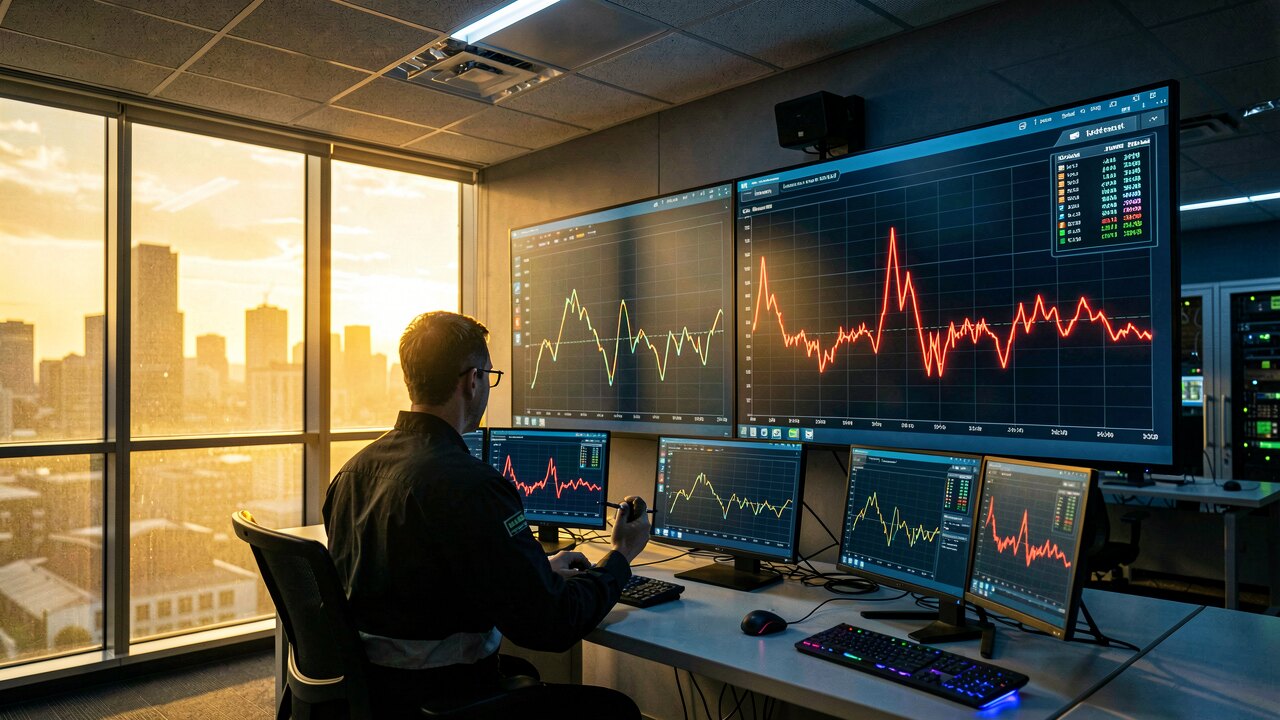
PV power follows a daily bell curve: 0 kW before sunrise, climbing to a midday peak, back to 0 after sunset. Cloudy days show a jagged, lower curve. Daily yield in summer is far higher than in winter for the same system. A healthy display updates every few seconds and matches roughly what you'd expect for the weather. Steady green status LEDs on the inverter usually mean normal operation.
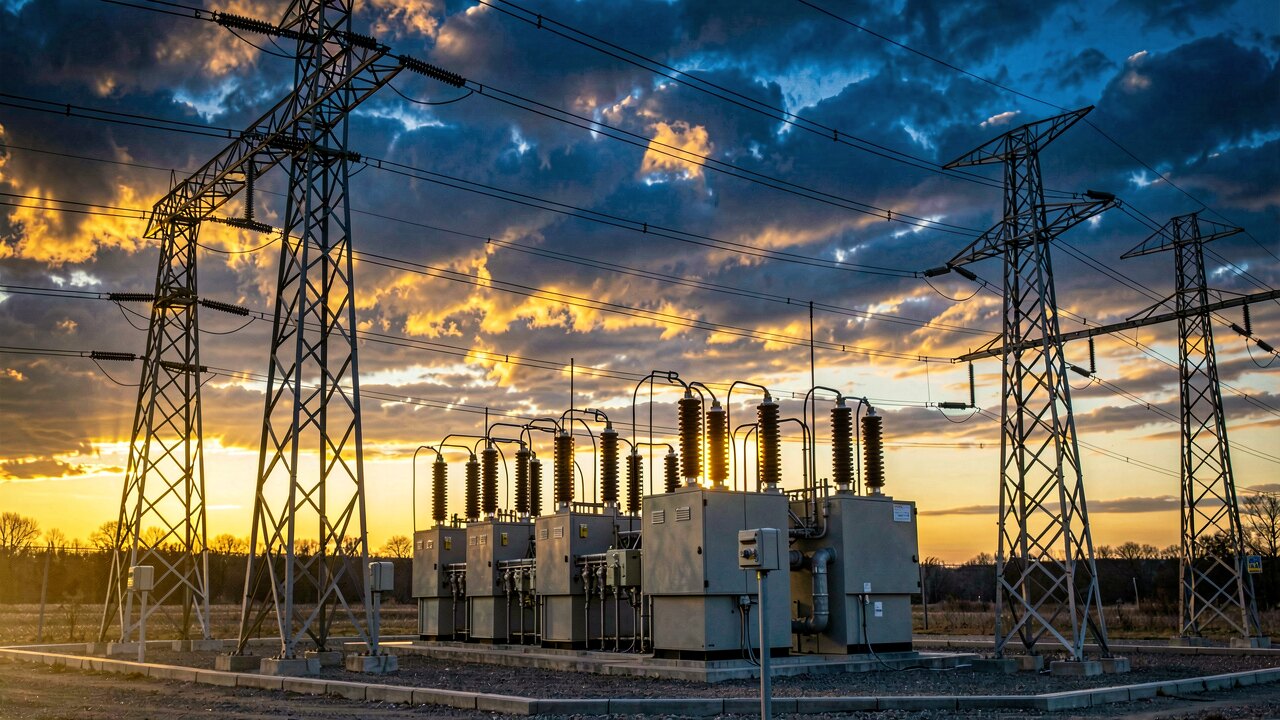
If the display reads 0 kW, blank or dashes during daylight: first check the time — production is genuinely 0 at night. In daytime, check the inverter status LED/code (red or blinking often signals a fault or grid issue), that the DC/AC isolator switches are on, and that the data connection (WiFi/LAN) to the portal is live — a lost connection freezes remote values while the panels still produce. A specific error code should be looked up in the inverter manual before calling an installer.
Modern monitoring combines several tiles: PV power (kW), battery SOC (%), house load (kW) and — in smart or trading setups — the live electricity price (€/MWh). Read them together: high PV + low load means surplus (battery charges or grid feed-in); low PV + high load means the battery discharges or you draw from the grid. This is how energy-management systems decide when to store, use or sell power.