Solar Energy Display: What It Shows and How to Read It
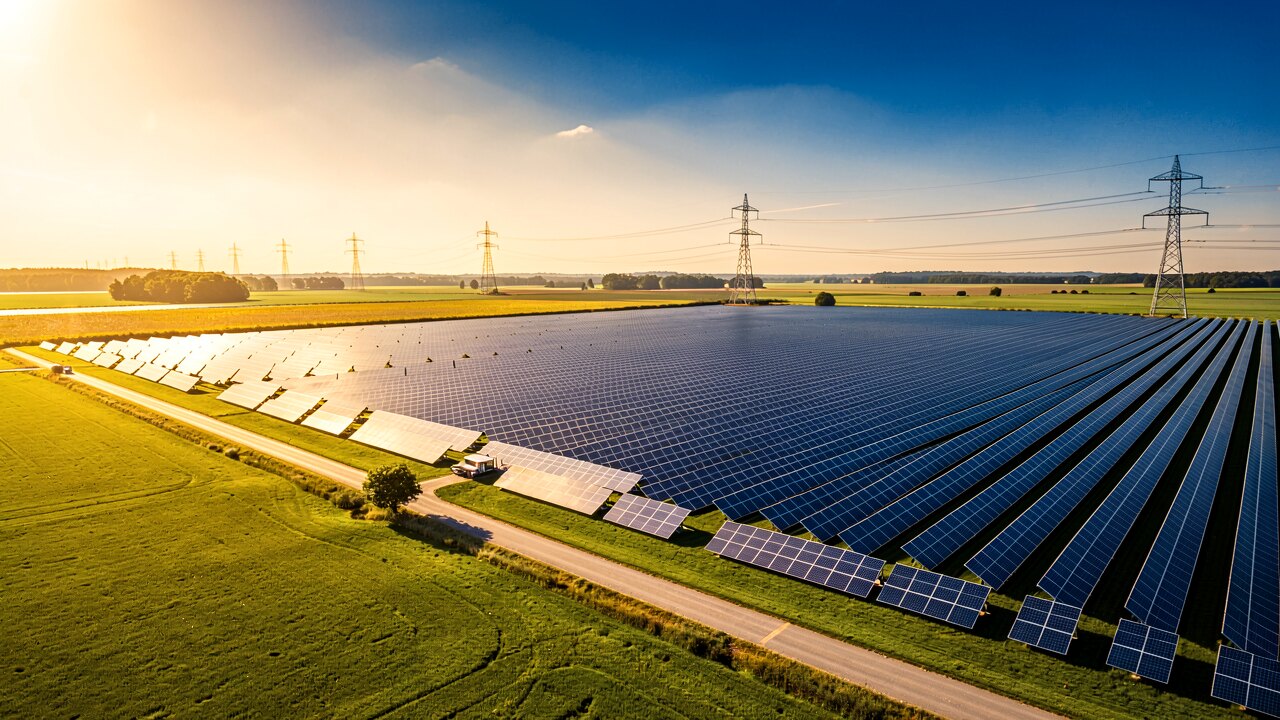
A solar energy display (German: "Anzeige Solarenergie") is the readout that shows how much power your PV system is generating, using, storing and feeding to the grid right now. This page explains what each figure means and how to set up live monitoring.
A typical display presents four core values: current PV production (in kW), self-consumption, grid feed-in or draw, and — if you have a battery — its state of charge (SOC, in %). Many also add cumulative energy for the day (in kWh) and, in trading-oriented systems, the current spot price (in €/MWh).
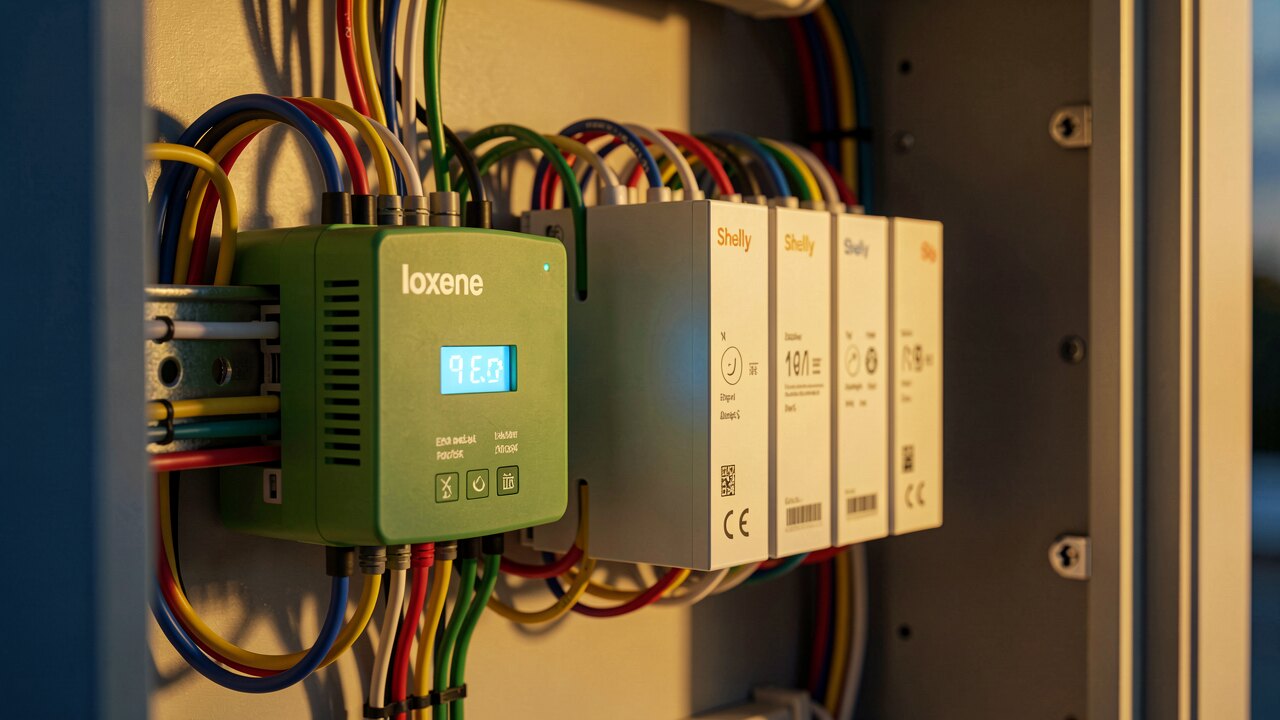
Power (kW) is the instantaneous rate at that second; energy (kWh) is power accumulated over time — a 400 kWp array producing 285 kW is running at about 71% of its rated capacity. SOC of 68% means the battery is roughly two-thirds full. Feed-in is surplus sent to the grid; a negative or 'draw' value means you are importing.
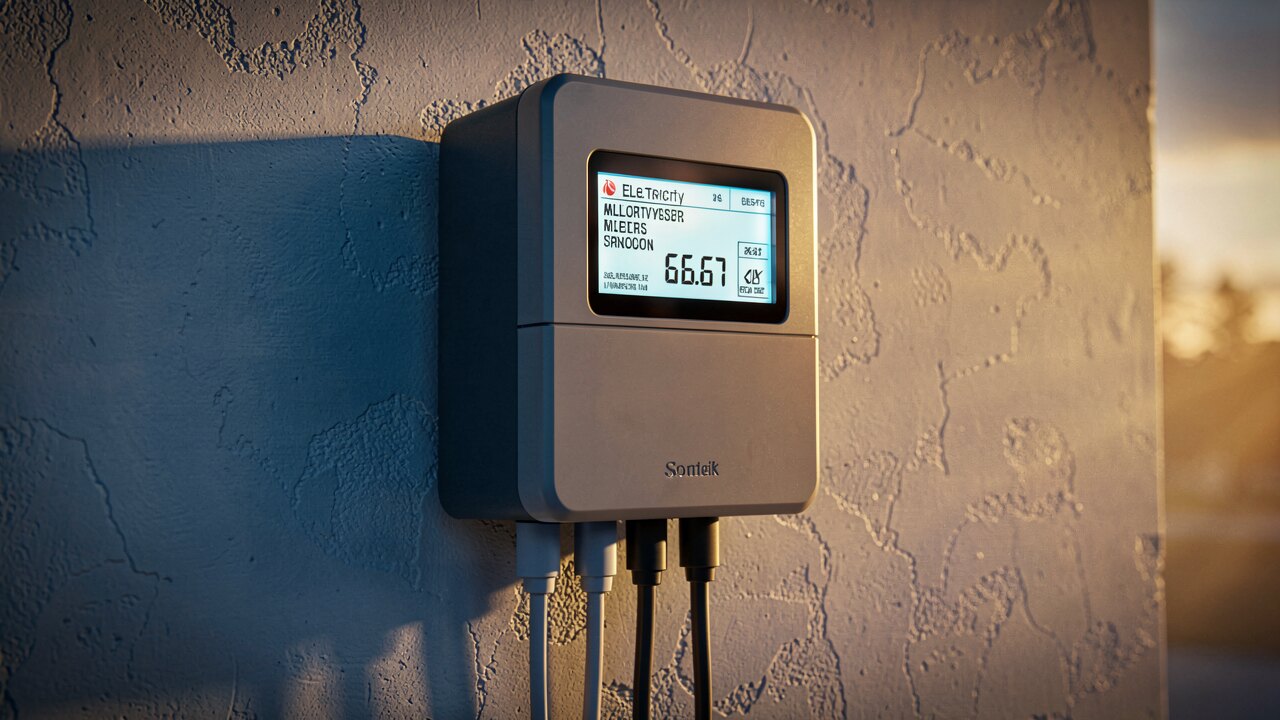
Readings come from the inverter and, if present, the battery management system and a smart meter. These devices expose data over interfaces such as Modbus, SunSpec or a manufacturer API, which a gateway or logger reads and forwards to an app, web dashboard or local screen.
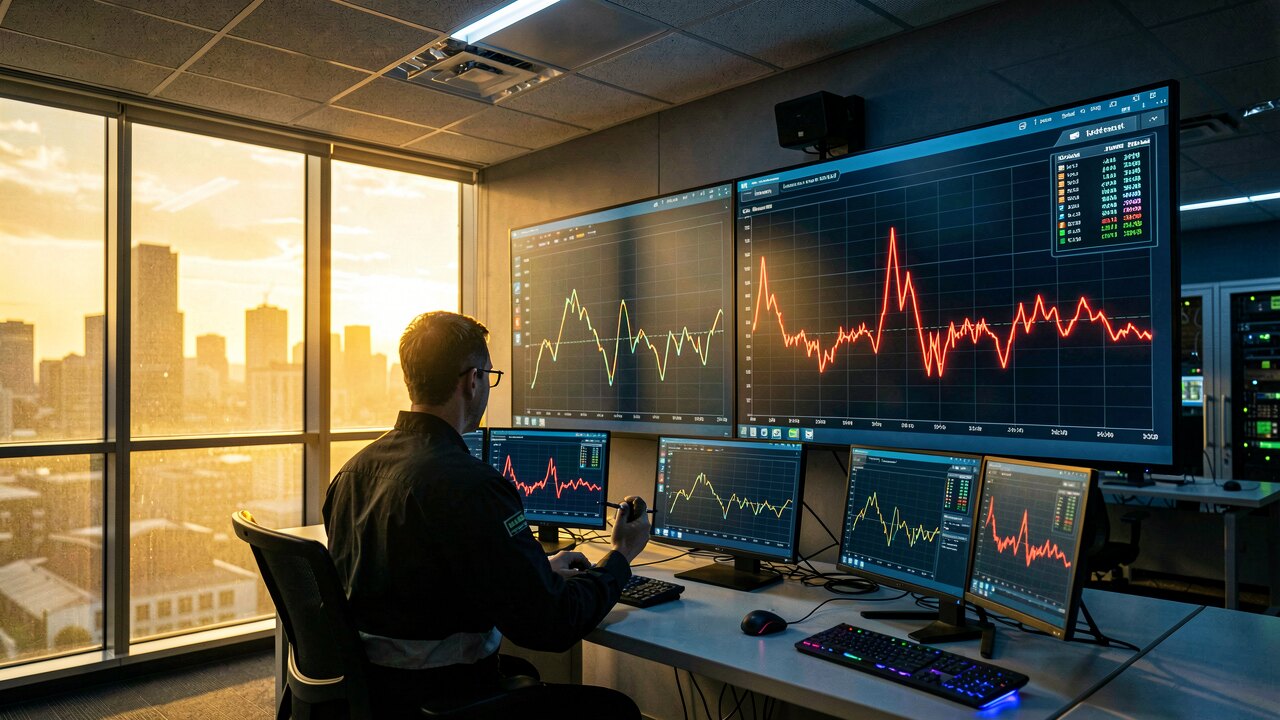
You can view your data on the inverter's own screen, the manufacturer's portal or app, or an independent dashboard that combines PV, battery and grid in one view. A live dashboard adds spot-price context and can suggest when to charge, discharge or store surplus — useful once you pair a battery with your PV.
Confirm your inverter's data interface, connect a logger or gateway to your home network, and link it to the app or dashboard you want to use. If you add a battery or want price-based control, ensure the meter and battery are read on the same interval so production, consumption and SOC line up in one consistent picture.
Reading the display lets you check the system is performing to spec, spot faults early (production far below expectation on a clear day), and raise self-consumption by shifting loads or storing surplus for the evening peak instead of exporting it cheaply.